7 65% Renewable Energies
WHERE WE PLAY > Energy
65% Renewable Energies in 2030
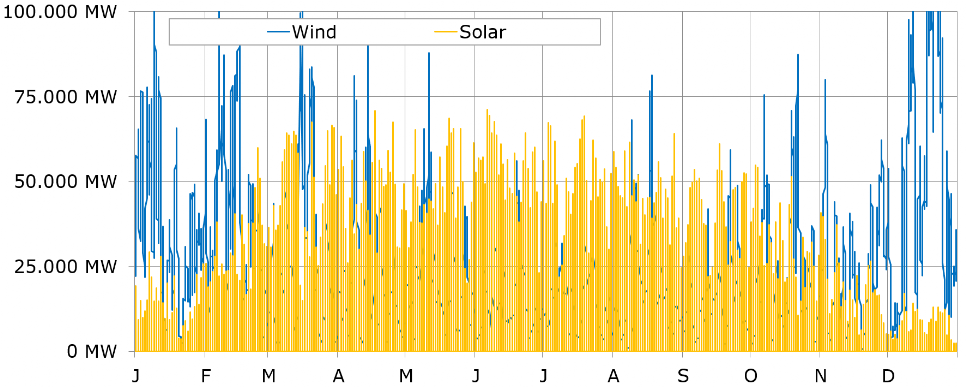
Wind and Solar Power Generation in Germany based on Weather Year 2015 extrapolated to the year 2030 with 65% renewable energies. In this chart PV is represented by the yellow line and wind by the blue line. It can be noticed that wind has its dominance in the winter season with peaks up to 100.000 MW while PV is much stronger during the summer time with peaks at 75.000 MW.
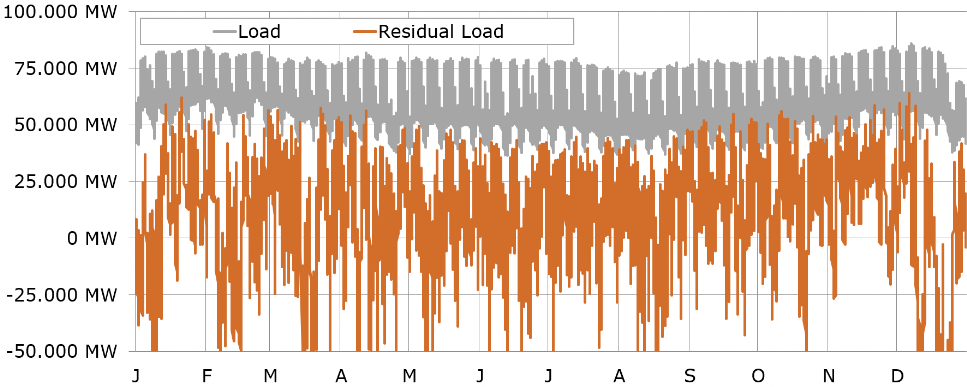
In this chart the grey line describes the German load profile. It can noticed the daily and weekly profile of the demand.
The red line represents the residual load after the Wind and PV generation is substracted from the load profile. This residual load needs to be filled by conventional power plants (including biomass and geothermal) or storage capacities.
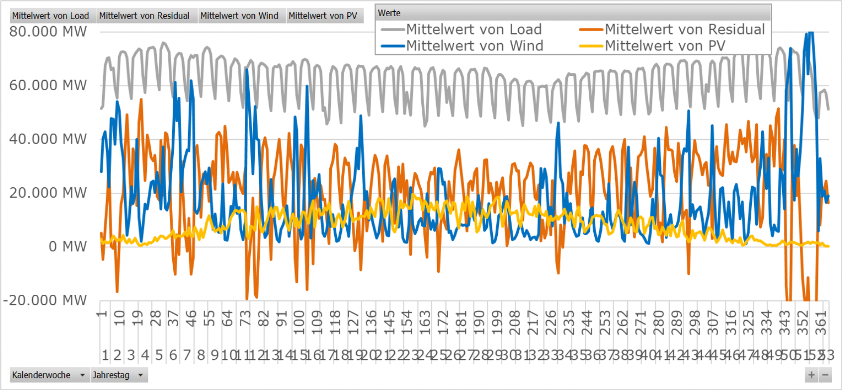
This chart demonstartes the daily averages for the four categories Load, Wind, PV and Residual Load. This gives an idea of the remaining challenge in case of storage capacities equal to one day of consumption. Now in the load profile the day/night differences of 40 GW are gone and only the week/weekend differences of 20 GW are visible.
Assuming storage capacity for a whole week of consumption and averaging the figures for each week, reveals a remaining challenge of 40 GW residual load in winter times. The stong wind periods in the winter season
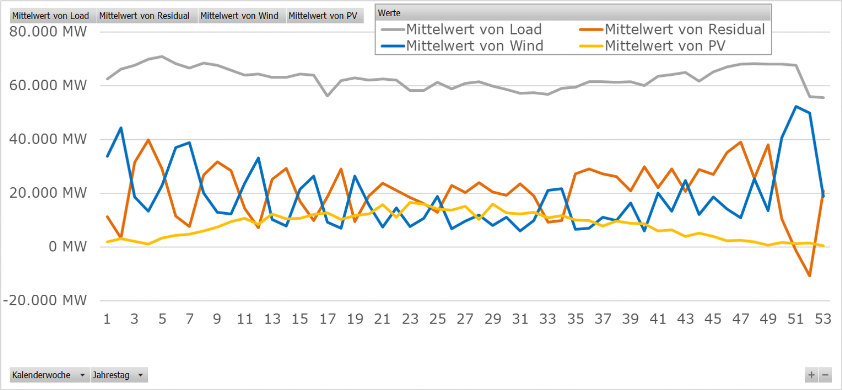
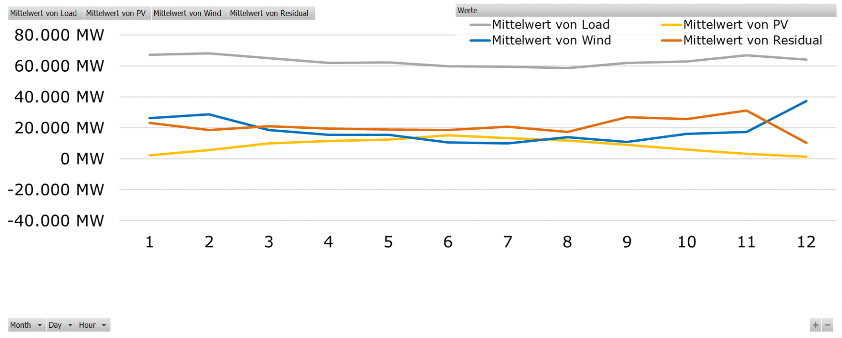
Moving from weeks to months reduces the variability in the different categories further. The peak for residual load diminishes to 30 GW. The combined generation of PV and Wind averages between 20 - 30 GW per month and is more stable than the individual contributions, especially as PV and Wind are complementary in its seasonality.
This modelled scenario shows the challenges and potentials that lay ahead of Germany with its goal to reach 65% renewable energies in 2030. Taking the annual averages for the four categories results in an average load of 63 GW, a residual load of 21 GW, PV of 10 GW and Wind of 20 GW. The remaining difference are other renwable energies like bio mass, geothermal, hydro etc.
The whole scenario assumes a perfect use of PV and Wind which requires the aluminium platform for Germany, meaning enough high voltage lines and hence transport capacity.
Furthermore it shows the remaining challenge for the residual load between 20 GW annual average and peaks of 70 GW. Beside conventional storage it will be necessary to develop all means of Demand Side Management, residential and industrial. According to DENA (https://www.dena.de/themen-projekte/energiesysteme/flexibilitaet-und-speicher/demand-side-management/) the industrial DSM potential could be in the order of up to 15 GW. Developing this potential could be the great enabler for success.
General Comment:
I would like to point out that it is essential to distinguish between power (MW) and energy (MWh). Power is equivalent to the force that is applied while energy is equivalent to the work that is delivered. You apply a force over time and you achieve the work. Talking about electrical networks, power plants and storages it is always necessary to carefully apply this. Especially when talking about batteries it is obvious to know both parameters. What is the maximum power that can be delivered, e.g. 1 MW and what is the maximum capacity that can be stored, e.g. 1 MWh (--> 1 MW for 1 hour or 0.5 MW for 2 hours etc.)